Showing posts with label UNEMPLOYMENT. Show all posts

Wednesday, July 18, 2012

EUROPEAN YOUTH UNEMPLOYMENT - A REAL CRISIS.

A really worrying issue that has only started to feature in business news recently, is youth unemployment.

Below is a chart of European youth unemployment by Adam English at Inside Investing Daily.

Another Link, this time from the Telegraph:

Youth unemployment passes 50pc in Spain and Greece - Telegraph

Wednesday, February 16, 2011

Kick the can down the road, as far as it will go, buy as much time as possible!

As the ongoing bull run in the equity markets continues, I thought that it was appropriate to post some charts from Breakfast with Dave - 18th Jan, 2011.
Complacency and exuberance and ''bullishness'' is blinding speculators and investors to the many structural problems of today's global economy.

Job creation and food security ( in both the developed world and emerging markets) are going to be crucial issues going forward, and unfortunately the ongoing policies of governments worldwide are continuing to fuel asset price inflation and stock market rallies rather than addressing the real problems we have at hand.
.
.

Friday, January 28, 2011

INVESTING WITH THE HERD

I came across this article via David Rosenberg's article on the 24th of Jan 2011.
Here is the permalink to the NY Times article.
http://bucks.blogs.nytimes.com/2011/01/17/investing-with-the-herd/
It's an excellent article for investors to read right now, given the complacency that has crept into stock market valuations.

Carl Richards is a certified financial planner in Park City, Utah. His sketches are archived here on the Bucks blog, and other drawings are available on his personal Web site, BehaviorGap.com.

Since March 2009, we’ve watched the market rebound by 80 percent. Whether you’ve sat it out on the sidelines or think you can predict what comes next, I recommend you take a step back and remember a few things.

You are not as smart as you think. Overconfidence is a huge behavior
problem for investors.
Overconfidence is what happens precisely because we think we know a lot about the subject, but overconfidence can lead us to make mistakes that in hindsight will be glaringly obvious (but the tricky part is that we didn’t know it at the time).

Following the herd doesn’t make it safe. I know it’s exciting and fun to be an investor in Apple or Google right now. Then there’s the talk about getting access to the private initial public offering of Facebook through Goldman Sachs. Buying because everyone else is buying is not an investment strategy. These companies may be great investments, but not just because everyone else is buying their stock.

We’re social animals who feel safer in numbers, but so do sheep. We take comfort in doing what everyone else is doing, and in the back of our minds we know that even if we’re wrong, at least we’ll be wrong with a bunch of other people. But it was the same line of thinking that led us to do very stupid things in high school just because “everyone else was doing it.”

Investing is about behavior, not skill. Maybe you’ll accuse me of beating a dead horse, but successful investing is about how you behave. Buying high and selling low is dumb, but it’s worth repeating given what I’m seeing in the market today. It’s important to remember that you could own a “mediocre” mutual fund, and if you behave correctly you can outperform 99 percent of your neighbors. On the other hand, if you spend your whole life searching for the “best” investment, you’ll ruin your entire lifetime return in one single behavioral mistake.

I know that what I’ve outlined sounds obvious and easy to scoff at, but the fact that it’s obvious didn’t keep investors from loading up on tech stocks in the late 1990s, bonds in 2002, and real estate in 2006. As we enter 2011, and the excitement of our financial New Year’s resolution starts to wear off, please remember that it’s worth taking the time to stop and think before you invest.

Tuesday, January 11, 2011

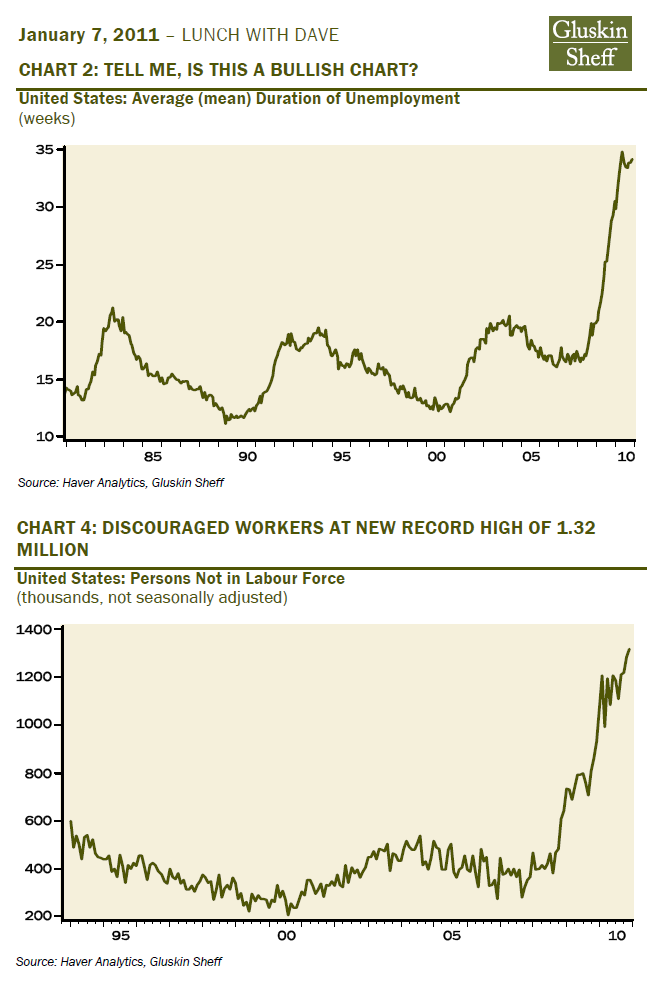
DAVID ROSENBERG on US UNEMPLOYMENT

The graphs below come from 'Lunch with Dave' - January 7, 2011.

..

Tuesday, August 10, 2010

US MEDIAN DURATION OF UNEMPLOYMENT

As the market eagerly awaits some FED news flow, here is a chart that deserves a closer look.

While the unemployment rate has continued to remain under 10%, the chart below shows that this is still one '''tough''' job market.
If the recovery is to be led by consumer consumption, then this chart must begin trending downwards!
.
Continuing stress in the housing and job market coupled with an increase in the savings rate and lacklustre credit offtake further reinforces David Rosenberg's stand that ''frugality is here to stay''

Tuesday, May 11, 2010

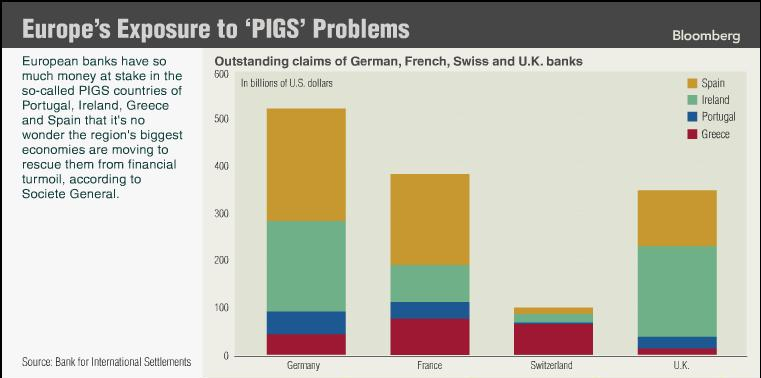
$962 Billion : Bailout of Club Med or the BANKS !!!

The markets certainly loved the mega ECB show of force.

Equity markets in Spain, Portugal and Greece soared, but did anyone notice how the financial stocks in France and Germany reacted yesterday!

AXA +21.87 %

BNP Paribas +20.90 %


Société Générale +23.89 %

Commerzbank + 8.97 %

Deutsche Bank +12.62 %


Here's an interesting take from Socio - Economics History Blog

Europe's Exposure To 'PIGS' Problem! « Socio-Economics History Blog


Sunday, March 7, 2010

LOW VIX SUGGESTS COMPLACENCY !

As the rally in global equities continues, investors seem to be ever ready to take on more risk!

Nevermind the chaos in the job market or the troubles in the Eurozone, or the rickety finances of states like California & Illinois in the U.S.A.

The VIX is trending to new lows for 2010. I think it's high time that investors hedge their portfolios or just take some chips off the table.


These are uncertain times, and there's a lot of ''not so normal'' stuff going on!

FEDERAL SPENDING AS A PERCENT OF GDP


UNEMPLOYMENT


Monday, January 18, 2010

David Rosenberg on - Total unemployed relative to Total Job openings

Here's David Rosenberg on the total unemployed/ total job opening ratio:

''''Note that there are now a record 6.4 unemployed per job opening — double the highest level posted during the 2001 recession — which is a supply-demand mismatch in the labour market that is sure to accelerate the downtrend in wages (vivid in the NFIB survey too). ''''''


Also, here's what David Rosenberg had to say on the VIX

''''And the VIX index, at 17, is symptomatic of this high level of complacency — it was 22 a month ago and over 40 when the stock market was bottoming last March. The fact that investors are behaving as if there is minimal chance of any possible downside surprises occurring is perhaps the most glaring red flag over this bear market rally — from a contrarian standpoint, the widespread bullishness is bearish. ''''

Wednesday, January 6, 2010

WELCOME TO 2010 !

Well i'm back again!
Before I begin posting new stuff for 2010, let's just take a quick look back at investment returns of the last decade!

Here's a chart from Jesse's Café Américain. Even as Gold and Silver have been star outperformers, its just amazing how little coverage they get on CNBC!

Chart of the day covers a multi decade DJIA return chart.


Clearly the 1980's and 1990'S were years of blockbuster returns in US equities.
Expert stock pickers like Warren Buffett generated market beating returns over this period.
Looking at returns over the 1960's and 1970's is almost frightening! Can the current ipod-blackberry-google search generation cope with it!
It's happened before, but can we cope with marginal returns while servicing a massive debt overhang this time round?

The Indian equity markets had a fantastic last decade.
Just a few years prior to 2000, India's manufacturing sector was in bad shape. Over the last decade, these same manufacturers have bounced back - cutting costs, improving efficiency and product quality.

Companies in the IT services space have also survived the 2000 IT/ dotcom meltdown, and have become globally recognised franchises.
The current decade will need record investments in infrastructure development if India is to emerge as a ''superpower'' by 2025!!
Reducing income disparity and improving the standard of living of people in rural India are also crucial to India's future development.

Lastly, I'd like to draw your attention to the CBOE VIX volatility Index.
Jesse's Café Américain has a good chart on the VIX.
We are not out of the woods yet! The world economy is getting ''addicted'' financial stimulus packages and ever expanding government debt and deficits.
Those looking for jobs and those trying to hang onto jobs they ''despise'' are clearly not as optimistic as equity market analysts are.
I will be putting up a post on ''what to look forward to'' and ''what to look out for'' in 2010. I'm working on it now, but it should be up in a couple of days.

Wednesday, December 9, 2009

Monday, November 23, 2009

BEWARE THE CONSENSUS VIEW!

Here's a chart from a recent update from David Rosenberg


Dont forget Bob Farrell's rule No. 9:

"When all the experts and forecasts agree -- something else is going to happen"

Friday, November 6, 2009

US UNEMPLOYMENT CONTINUES TO RISE !

The jobless recovery continues.
The Stress tests were way off !! They were nowhere stressful enough; no wonder the banks passed with flying colours. The Market Ticker Blog has more. About Those Stress Tests...


Lastly here's yesterday's post from The Automatic Earth Blog.

November 5 2009: Here's how to stop the bleeding

Here's an excerpt

Dylan Ratigan in conversation with William Black:

Ratigan: We have legalized the casino gambling with taxpayer money, literally. It is legal for proprietary trading, which is idle speculation, although perhaps well informed and profitable, with the use of taxpayer insured assets.


Black: We not only legalized it, we backstopped it. If you win, it all goes to you, if you lose, it all goes to the taxpayers, and the American people. That is insane. Everybody knows that’s insane."

Wednesday, July 22, 2009

SHOCK & AWE : CHARTS SAY IT ALL

Click on the chart for an enlarged image.


It's going to take time and a whole lot of hard work to fix this!

Saturday, July 18, 2009

UNEMPLOYMENT : JUNE 2009

Bonuses may be the norm at Goldman Sachs, but the 9.5% national unemployment rate tells another story.
Optimists may be hoping for a jobless recovery, but its hard to see any genuine recovery occur anytime soon, given the downward pressure on wages and the continuing job losses.

Just imagine explaining Goldman Sachs' record bonuses to the people in Michigan!!!

Here was my post on April 18, 2009

US UNEMPLOYMENT - MARCH 2009.

Below are the June 2009 figures:

Monday, June 15, 2009

EMPLOYMENT STATISTICS

Here are a few charts from a recent U.S. Bureau of Labor Statistics May2009 press release.
http://www.bls.gov/web/ceshighlights.pdf

Don't just focus on the headline numbers, unemployment is on the rise, and there is more pain ahead.
The manufacturing sector is struggling and the recent bankruptcy filings in the auto sector are going to add to job losses.

Unlike the recession after the dot com crash, the US Consumer is quite stressed out.

US home prices are still dropping, debt levels are at record highs and its the worst job market in years.


Saturday, April 18, 2009

US UNEMPLOYMENT - MARCH 2009.

Hat tip to Mish's Global Economic Trend Analysis blog for the link.

As I've said in recent posts, unemployment is going to severly impact the ability of individuals and firms to service their debt.