I was analysing a chart I found at 321gold.com
Here is the original link. Mr Boris Sobolev does a good fundamental analysis here.
Jul 20, 2009 What Will it Take for Gold to Overcome $1000? Boris ...
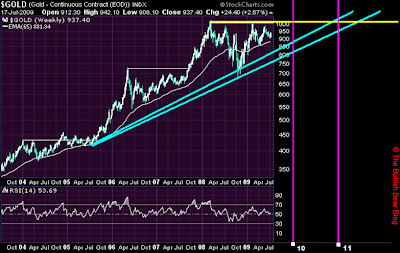
Here is the chart from Boris Sobolev's article that I have worked on (the bold trendlines are mine). Sometimes it really helps to analyse a long term chart.
Gold has clearly had a phenomenal run!
While some analysts have called for a bullish inverse head and shoulders formation (2008-today), others have called for a cup and handle formation.
My own view it that the medium term movement in gold prices is most likely going to resemble the consolidation that gold saw in the July 2006- July 2007 period. (take another look at the chart)
This could mean that we could make a clean break above the $1000 mark sometime by mid 2010, if not earlier.
That 'mega' breakout, would resemble the breakout that gold saw after the July 2006- July 2007 consolidation. After that, $1000 will become a new floor rather than a ceiling, just like the $700 level became the new floor after the Sept 2007 breakout!
On the downside, gold would see considerable support in the $800-850 range. As I have said many times before, June until September is a period of seasonal weakness in gold
I continue to be a bullion permabull!! Patience is the keyword!!
Equity markets meanwhile continue to rally, totally ignoring deteriorating employment data.
Corporate profits ex banks, have benefited from cost cutting and layoffs rather than any genuine consumption demand. I say 'ex banks', because anyone who takes the reported profits of large cap US financials at face value, better ask for a detailed statement of securities that are marked to market.
As and when equity markets lose momentum and realisation of the ground reality on 'Main Street' sets in some time in early 2010, we could be in for another down leg in equity markets.
Here is the original link. Mr Boris Sobolev does a good fundamental analysis here.
Jul 20, 2009 What Will it Take for Gold to Overcome $1000? Boris ...
Here is the chart from Boris Sobolev's article that I have worked on (the bold trendlines are mine). Sometimes it really helps to analyse a long term chart.
Gold has clearly had a phenomenal run!

While some analysts have called for a bullish inverse head and shoulders formation (2008-today), others have called for a cup and handle formation.
My own view it that the medium term movement in gold prices is most likely going to resemble the consolidation that gold saw in the July 2006- July 2007 period. (take another look at the chart)
This could mean that we could make a clean break above the $1000 mark sometime by mid 2010, if not earlier.
That 'mega' breakout, would resemble the breakout that gold saw after the July 2006- July 2007 consolidation. After that, $1000 will become a new floor rather than a ceiling, just like the $700 level became the new floor after the Sept 2007 breakout!
On the downside, gold would see considerable support in the $800-850 range. As I have said many times before, June until September is a period of seasonal weakness in gold
I continue to be a bullion permabull!! Patience is the keyword!!
Equity markets meanwhile continue to rally, totally ignoring deteriorating employment data.
Corporate profits ex banks, have benefited from cost cutting and layoffs rather than any genuine consumption demand. I say 'ex banks', because anyone who takes the reported profits of large cap US financials at face value, better ask for a detailed statement of securities that are marked to market.
As and when equity markets lose momentum and realisation of the ground reality on 'Main Street' sets in some time in early 2010, we could be in for another down leg in equity markets.

1 comment:
So it looks like gold is the best type of investment. The price for its growth and nothing can stop it.
Post a Comment