Saturday, November 27, 2010

GOLD - TOO FAR TOO FAST?

Here's an update from Przemyslaw Radomski of Sunshine Profits. He says that Gold is near a critical resistance and consolidation is likely.


Graham Summers of Gains Pains & Capital warns of the possibility of a correction in gold prices, given the herd like negative sentiment towards the USD at the moment. Notice the '''negative rising wedge''' in the chart below.
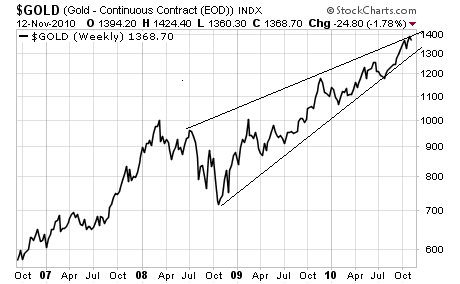

Personally, the awesome relative strength in precious metals (especially Silver) in recent months has surpassed my rather conservative estimates.
.

QE2 has come and gone and there's no solution to the ongoing ''recession'' as yet. Commodity prices are just about the only thing that have responded positively to the FED's QE2!!!
.
Meanwhile, Club Med in Europe is showing no signs of turning around, and this has taken the edge off the recent Euro rally. The USD Index has recently crawled back above the 80 mark.
Below is a long term USDX chart by Graham Summers.
.
Remember, just because the USD is headed downward over the long term, doesn't mean that it can't stage a counter trend rally in the near term.

.
Equity markets, especially emerging markets are refusing to factor in the possibility of a relapse in the global economy.
.
A cautious wait and watch approach may be the best way forward for now.
Traders may consider hedging some long gold positions.
.
Short term corrections aside, I remain a long term Gold Bull!

Wednesday, November 24, 2010

Monday, November 15, 2010

BANANA REPUBLICS ...FINANCIAL CRISES & MEGA BAILOUT PACKAGES

Sorry for the infrequent posting of late.
The USD seems to be trying to stabilise, even as gold prices cool off after striking new highs.

Here is a fantastic article that addresses the topic of Banana Republics!
Currency wars / manipulation continue and as bailout packages are announced, many are still asking questions as to who the final beneficiaries of these handouts will be ??

Here's an excerpt from the NY Times article of Nicholas Kristof -

The richest 1 percent of Americans now take home almost 24 percent of income, up from almost 9 percent in 1976. As Timothy Noah of Slate noted in an excellent series on inequality, the United States now arguably has a more unequal distribution of wealth than traditional banana republics like Nicaragua, Venezuela and Guyana.

C.E.O.’s of the largest American companies earned an average of 42 times as much as the average worker in 1980, but 531 times as much in 2001. Perhaps the most astounding statistic is this: From 1980 to 2005, more than four-fifths of the total increase in American incomes went to the richest 1 percent.

That’s the backdrop for one of the first big postelection fights in Washington — how far to extend the Bush tax cuts to the most affluent 2 percent of Americans. Both parties agree on extending tax cuts on the first $250,000 of incomes, even for billionaires. Republicans would also cut taxes above that.

The richest 0.1 percent of taxpayers would get a tax cut of $61,000 from President Obama. They would get $370,000 from Republicans, according to the nonpartisan Tax Policy Center. And that provides only a modest economic stimulus, because the rich are less likely to spend their tax savings.

At a time of 9.6 percent unemployment, wouldn’t it make more sense to finance a jobs program? For example, the money could be used to avoid laying off teachers and undermining American schools.

Likewise, an obvious priority in the worst economic downturn in 70 years should be to extend unemployment insurance benefits, some of which will be curtailed soon unless Congress renews them. Or there’s the Trade Adjustment Assistance program, which helps train and support workers who have lost their jobs because of foreign trade. It will no longer apply to service workers after Jan. 1, unless Congress intervenes.

So we face a choice. Is our economic priority the jobless, or is it zillionaires?

Wednesday, October 20, 2010

CURRENCY VOLATILITY

Well, after trending downwards for weeks, the USD seems to have stabilized for now, and a counter trend rally in the USD is underway.

Here are some charts that tell the whole story. No one seems to want a strong currency!


  • The rally in the EUR, JPY and CHF will hurt exporters in Europe, Japan and Switzerland.

  • A weak USD meanwhile, will boost US exports.

  • The Chinese have thus far resisted any significant appreciation in the Chinese Yuan.

USD CHF : The CHF broke down below parity in its recent rally vs the USD

USD CAD : It came ever so close to testing parity vs the USD

USD JPY : Despite the efforts of the Bank of Japan to weaken the JPY, the JPY continues its relentless upward march.

EUR USD : A weak EUR helped boost Germany's GDP numbers last quarter. the recent rebound in the EUR will surely make life difficult for the Club Med nations

Conclusion:

The USD appears to be oversold in the near term and a counter trend rally is underway. The market is betting on some mega fire power solution from the US Fed at its meeting in November. If QE2 disappoints and the equity markets sell off, the USD could stage a much stronger rally!

The Equity markets have been getting far too complacent about the weak and worrying news data and unemployment numbers in the US.

Fund flows to emerging markets have boosted stock prices across the board and a correction is well overdue. These markets are ''not decoupled from the actions of the US Fed'' and when the tide starts to turn we can expect large fund outflows to have a drastically negative impact on stock prices in emerging economies

Lastly, the rally in Gold prices also appears ripe for correction and consolidation. Silver prices too, are clearly overstretched in the near term. expect lower prices if the USD stages a comback rally. It's not time to be buying the precious metals sector just yet!

Watch this space!

Thursday, September 30, 2010

LENGTH OF U.S. RECESSIONS

Here are a couple of charts on the ''now ended'' Great Recession.

Monday, September 20, 2010

GOLD & SILVER - NOT PARABOLIC YET ??

I recently came across some gold charts while reading a link I found at kitco.com

Below is an article by Dudley Pierce Baker. He discusses the parabolic moves in precious metals during 1979-1980.


He does make a valid point. Take a closer look at the above two charts.

Now those were parabolic moves!!

Could gold and silver have a repeat performance of those parabolic moves?

Well all I can say is who knows! Gold has been the top performing asset class of the last decade. The Every bull market has corrections along the way and the precious metals sector is no exception. So expect corrections and panic selling as part of the ongoing gold bullion bull market. The fundamentals are rock solid and long term buy and hold strategy is advised.

Once again I would like to warn investors not to try to time the precious metals market or indulge in leveraged trades when gold prices are rising. Instead look to buy in only after sell offs and corrections rather than chasing rising prices.

The Monetization Equation

Taipan Daily's Justice Litle & John Williams of Shadowstats.com have the following view on the monetization equation and the rally in Gold prices.

This could help explain the rally in gold prices despite the ongoing deflationary environment.
.
As David Rosenberg has been pointing out in recent times, the ''bond market rally'' has resulted in mortgage rates remaining near record lows. As a result, the bond market has helped to cushion the slump in the housing market.
.
This will make it even more difficult for the fed to raise interest rates in the near future.
All in all the aftermath of a bust of a bubble created by cheap credit takes time to sort out and the adjustment can be painful.
.
There is no quick fix, as consumers return to living within their means and go back to age old practices of saving and taking on less debt!

Friday, September 17, 2010

GOLD - IT'S RALLYING AGAIN !

Just about everyone seems to be bullish on gold at the moment.

As bullish momentum takes over, we could be in for higher prices in the days ahead.

Over the last month, silver has soared from levels of $18 -$18.50 to almost $20.80 currently.


Below is a chart by Chris Vermeulen, who acknowledges the currrent bullishness, but wisely takes a step back to take a look at the ''big picture''

Here is Chris Vermeulen's article on kitco.com


While I remain both a gold bug & bull, it's worth noting that the equity markets may be overly optimistic about earnings estimates for the second half of 2010.

The USD has been beaten down by the recent lack of risk aversion.
/
If market tremors re emerge, gold could sell off. Just to put things in perspective, a 20% sell off from the current level of $1273 will still mean that gold will continue to trade over $1000.
.
All that I'm saying is that fresh buying may be postponed for the time being, and that its advisable for long only, long term investors to wait for a pull back before jumping in at current prices!

Wednesday, September 15, 2010

Where are we headed to now ?

Well it's been a while since my last post.

Markets have been bullish across asset classes. Equities, Bonds and precious metals, all rallying at the same time!!
U.S. unemployment numbers as well as the continuing slump in the US housing market continue to be worrying reminders that all may not be well with the global economy.

David Rosenberg recently reminded us that the U.S economic recovery has been largely dependent on government support (think mega bank bailouts, cash for clunkers, food stamps, infrastructure funding packages etc). By this stage of the game and given the extraordinary stimulus packages of the last two years, the economy should have been growing strongly.

Instead it looks like the U.S. economy is unable to survive on its own, given its slumping home prices, high unemployment numbers and high consumer debt levels.
Even Ben Bernanke is looking to cut growth forecasts while remaining silent about the eventual withdrawal of 'fed support' for the economy.

The FED & GSE's continue to support the housing market, even as home prices continue to remain weak.
No government in the western world can risk withdrawing its support for the ongoing ''fragile'' economic recovery. In fact, many are contemplating another round of stimulus packages to head off a slowdown in the second half of 2010.

Here's a quick roundup -


  • Gold and Silver are on a surge yet again, after trading confidently throughout this summer. They appear to be overbought in the near term, especially silver which has had an almost vertical rise over the last fortnight.

  • US Equity funds continue to see outflows, while US debt funds continue to see further inflows.

  • US Equities have been rangebound in the 1030-1130 range on the S&P 500.There have been multiple corrections and rallies and despite regular tremors about the Club Med economies, the Euro and the state of finances of the states like California in the U.S.A --markets have chosen to ignore any worrying news.

  • Emerging market equities are rallying again and decoupling theorists are back to claiming that the BRIC economies can thrive and grow despite global headwinds.

  • The Indian equity market has been an outperformer in 2010 YTD. The rally is spreading to the mid caps and small caps. Overall the markets appear to be factoring in growth rates that may prove to be a tad unrealistic, especially if we see any turmoil in the ever slowing western economies

Overall, I continue to be wary of the ongoing rally in equity markets that seem to refuse to acknowledge poor economic data as well as the total lack of confidence on main street (especially in the developed world).

Are equity markets adequately factoring in a possible slow down in the second half of 2010? - I think not

Remember, it's better to be realistic that hopelessly optimistic.

I am still bullish on precious metals. We are also entering a 'seasonally strong' period for precious metals. Caveat Emptor - A sell off in equity markets will trigger a sell off in precious metals.

Expect upcoming posts on Gold, Silver and Indian Equities in coming weeks.

Tuesday, August 10, 2010

US MEDIAN DURATION OF UNEMPLOYMENT

As the market eagerly awaits some FED news flow, here is a chart that deserves a closer look.

While the unemployment rate has continued to remain under 10%, the chart below shows that this is still one '''tough''' job market.
If the recovery is to be led by consumer consumption, then this chart must begin trending downwards!
.
Continuing stress in the housing and job market coupled with an increase in the savings rate and lacklustre credit offtake further reinforces David Rosenberg's stand that ''frugality is here to stay''