Showing posts with label USDX. Show all posts

Saturday, June 29, 2013

GOLD : POST THE RECORD SLAM DUNK


Gold continued to sell off this week, and as the weak 'long' hands finally throw in the towel, gold sliced downwards through multiple support levels.


Where will it end? 
More on this below.


The Feds own balance sheet has expanded drastically over the last 6 years even as quarterly GDP growth rates hover at just under 2%

Bernanke has suggested that the Fed would gradually reduce its bond -buying, and cease it altogether by mid 2014. 
This has resulted in  a sell off in the US bond market. 
The US 10 Year Bond yield spiked upwards to just under 2.6% (from just under 1.6%)
Bernanke will have to keep an eye on the rising cost of borrowings, lest it derail the ongoing housing market recovery and destroy the ''wealth effect' he has tried so hard to create by boosting asset prices, i.e. US Equities and Housing.

With Federal Government debt at record highs, the last thing the FED needs is a rising cost of government borrowing.


The FED may have to keep its bond buying program going, just to keep the cost of borrowing low, and also to pacify the panicky bond market bulls who are currently weary that the long bull run in bonds is drawing to a close.

Coming to precious metals, The Bullish Bear continues to be a long term gold bull and views the current ''crash'' as  a cyclical correction (albeit a severe one) in  a secular gold bull run.

As Jim Sinclair once said " The price of gold is going much higher. The problems that give gold its reason to go higher are growing, not waning." 

After a one way bull run over the last decade, this correction will really stress test the weak hands that bought into gold over the last two years at prices of $1300-$1700.


As the momentum has shifted to the downside, pinpointing a bottom at this stage is impossible. 
However the drastic the sell off can result in a rebound from these oversold levels. 

Gold and Gold stocks are deeply oversold at the moment.

The Commitments of Traders Report (CoT) provides an important insight:-

Source:

In Gold We Trust 2013; Long Term Gold Price Target $2,230   June 27th, 2013


(An extremely detailed and well written report)

 The commitments of traders report (CoT)1currently shows – from a contrarian perspective – a clearly positive situation. It confirms that a great deal of speculation has been wrung out of the sector in the first half of this year. Many trend-following speculators in COMEX gold futures have apparently not only thrown in their bullish towels, but have embraced the downward momentum for gold by selling futures short. On the other hand, large commercial interests, the natural hedgers, considered by many as the “smart money” in gold futures, have very strongly reduced their net short positions. 
From October of 2012 to June, 2013, the commercial hedgers reduced their net hedges (net short futures positions) by 84%. They currently hold the smallest net short position since February, 2005. This means that the largest, most deep-pocketed and best informed traders have positioned themselves for higher gold prices.
Compared to October of last year, large and small speculators have decreased their net long positions by 91% and 99% respectively. 

For the same period the large speculators have increased their gross short positions seven-fold to record high bets the price of gold will fall further. Because they tend to trade with the current trend and momentum, generally more short-term oriented speculators reach their highest gross short positions at or near important long-term low turning points for the price of gold. Conversely, the commercials seek to hedge longer-term price risk. Commercial hedgers tend to reach their least net short positions at or near important gold price lows.

The commercial hedgers have not been net long gold since 2001 with gold then near $270, but following the 30-plus percent correction for gold since September, 2011, the industry hedgers and bullion banks are now the closest to becoming net long in 12 years. Indeed, on June 4, 2013 U.S. bullion-trading banks reported a 29,622-contract net long position for the first time since July of 2008 during the financial crisis with gold then USD $939. In our opinion this signals an attractive counter-cyclical entry point. The current positioning data in the futures market are what we would only expect in a mature downtrend and are a recipe for a pronounced rally.


For now, the Bullish Bear is cautiously monitoring the precious metals sell off.
Fresh buying can be avoided for now, until the dust settles.

Aggressive buyers could start accumulating on declines via staggered purchases. (start with allocating 5-10% of your total precious metals outlay on declines). While its too early to call a bottom, the substantial correction has provided a decent margin of safety.

I would recommend that investors 50-60% book profits on short positions in precious metals. 
A near term low may be in, and a short covering pull back could occur.

Watch this space!


MORE LINKS:

Physical Gold Market In Disconnect As Premiums Hit Record    June 26, 2013

Citi: Are Gold And Silver Finding A Bottom?

Submitted by Tyler Durden on 06/27/2013 22:30 -0400

The Golden (Sentiment) Rule: If It Isn’t Off The Chart Now, It Soon Will Be

Submitted by Tyler Durden on 06/28/2013 19:49 -0400

Gold and Gold Stocks –Signs of Life – Pater Tenebrarum  June 28,2013
”””””””””””””””
So what can we conclude? For one thing we can certainly conclude that there has already been an 'overshoot' in the gold stocks. As we have pointed out with respect to 'long term oversold' signals, once gold stocks become as oversold as they have recently been, the historical record suggests that a rally of between 55% to 550% can be expected to start from the eventual bottom.Moreover, we know for a fact that gold stocks most of the time tend to lead gold. This is very likely simply a result of the fact that the people who buy gold futures in many cases are also trading gold stocks. It would make sense for them to load up on gold stocks before they move into gold futures in size. Therefore, every serious divergence that appears could be a sign of an impending trend change. Whether this will be just a short term trend change, a medium term one or a long term one remains to be seen. Certainly the technical damage to date suggests that it will take some doing and a lot of  back and forth before the sector truly gets back on its feet.However, what we cannot firmly conclude yet is that the cyclical bear market is over. The evidence is just too flimsy to come to that kind of conclusion at this point. There are many alternative possibilities worth considering:  the gold stocks may simply be subject to some short covering. There may be some shenanigans going on related to end-of-quarter window dressing. It may simply be a pause, relieving oversold conditions before the long term downtrend resumes.It is therefore simply not possible to sound the 'all clear'. However, as we have emphasized previously, anyone buying at these levels with a very long term time horizon probably won't make a mistake. The major fundamental trends that have supported the gold bull market have not changed – although there have certainly been a number of medium term gold-bearish fluctuations in the support previously provided by negative real interest rates, credit spreads and forever rising US budget deficits. However, these fluctuations have in our opinion not truly altered the long term outlook. The painful measures that would be required for long term solutions of the problems besetting the global economy have not been taken and are unlikely to be taken in the foreseeable future. It seems far more likely that what government will resort to will be measures that are inherently gold-bullish.With regard to the recent 'signs of life', let us watch and see what develops. It certainly could be that we have just seen a major trend change, even though we have to reserve judgment on that for the moment. Nevertheless, the divergence we have just observed is no doubt quite noteworthy. It is precisely the type of divergence we would expect to see once the medium to long term trend does in fact change.””””””””


Wednesday, February 13, 2013

FED ACTIONS AND THE FINANCIAL CRISIS - SUMMARY BY GAINS PAINS AND CAPITAL

Graham Summers of Gains, Pains and Capital in a recent write up on Feb 4, 2013, very aptly sums up the actions of the US Fed

""""""""""""""
Here's a recap of some of the larger Fed moves during the Crisis:
  • Cutting interest rates from 5.25-0.25% (Sept '07-today).
  • The Bear Stearns deal/ taking on $30 billion in junk mortgages (Mar '08).
  • Opening various lending windows to investment banks (Mar '08).
  • Hank Paulson spends $400 billion on Fannie/ Freddie (Sept '08).
  • The Fed takes over insurance company AIG for $85 billion (Sept '08).
  • The Fed doles out $25 billion for the automakers (Sept '08)
  • The Fed kicks off the $700 billion TARP program (Oct '08)
  • The Fed buys commercial paper from non-financial firms (Oct '08)
  • The Fed offers $540 billion to backstop money market funds (Oct '08)
  • The Fed agrees to back up to $280 billion of Citigroup's liabilities (Oct '08).
  • $40 billion more to AIG (Nov '08)
  • The Fed backstops $140 billion of Bank of America's liabilities (Jan '09)
  • Obama's $787 Billion Stimulus (Jan '09)
  • QE 1 buys $1.25 trillion in Treasuries and mortgage debt (March '09)
  • QE lite buys $200-300 billion of Treasuries and mortgage debt (Aug '10)
  • QE 2 buys $600 billion in Treasuries (Nov '10)
  • Operation Twist reshuffles $400 billion of the Fed's portfolio (Oct '11)
  • QE 3 buys $40 billion of Mortgage Backed Securities monthly (Sept '12)
  • QE 4 buys $45 billion worth of Treasuries monthly (Dec '12)

The Fed is not the only one. Collectively, the world's Central Banks have pumped over $10 trillion into the financial system since 2007. This money printing has resulted in a massive expansion of Central Bank balance sheets, spread inflation into the system, and done nothing to address the key solvency issues that lead up to the great crisis."""""""""


Monday, December 31, 2012

GOLD AND SILVER - CONSOLIDATION IN A BULL MARKET

CLIVE MAUND once again has some excellent precious metal charts


Saturday, June 30, 2012

INDIAN RUPEE SLIDE CONTINUES

2012 has been another tough year for the INR.
With the ongoing policy deadlock, high energy prices, ''risk off attitude'' and unyielding inflation, the INR faces a rather challenging secong half for 2012.
Here is an article from the Economic Times 23.06.2012, that explains the plight of the INR in more detail.

Saturday, May 5, 2012

Canadian Banks dominate World's 10 Strongest Banks

Canadians Dominate World's 10 Strongest Banks
This is a Bloomberg link that makes for an interesting read.

For readers in Asia, we tend to be more familiar with the 'Too Big To Fail' American and European Banks. These include the likes of JP Morgan, Deutsche Bank, Bank of America etc.

However, prudent risk management, conservative lending policies and a strict regulatory policy have enabled Canadian Banks to grow even as Banks elsewhere struggled post 2008.


"CIBC (CM) was No. 3 in Bloomberg Markets’ second annual ranking of the world’s strongest banks, followed by three of its Canadian rivals: Toronto-Dominion Bank (TD) (No. 4), National Bank of Canada (NA) (No. 5) and Royal Bank of Canada (No. 6), the country’s largest lender. Bank of Nova Scotia ranked 18th, and Bank of Montreal was 22nd. "


The Canadian Dollar (CAD) too has been a currency that has outperformed over the last decade.
A stable Banking System and global investors searching for higher yielding currencies have contributed to the outperformance in the CAD.

Wednesday, August 24, 2011

GOLD : Overextended after a massive run : more volatility to come

After testing $1900, gold prices have corrected sharply. In the near term prices continue to remain overextended, well above supporting trendlines at $1640.

I continue to remain a long term bull, but would once again remind readers that in the short term, gold prices will continue to be volatile and reacting to options expiration and the FED's Jackson Hole meeting at the weekend.

Here is a fantastic chart from Jesse's Café Américain - a super site for all gold related news and excellent unbiased market analysis.

Wednesday, August 10, 2011

MARKET UPDATE: THESE ARE CRAZY DAYS

Just a quick post today before I put up some detailed analysis soon.


There's so much happening in markets these days - Debt Ceiling, US AAA downgrade, Equity Market crashes, a really manic VIX (Volatility S&P500 ^VIX), UK Riots and all the ongoing discussion of the ''fragile'' global economic recovery!!


Below is a snapshot of todays wildly gyrating markets! For the ''goldbugs'' out there, Gold has been riding high, driven upwards by all the uncertainty & it is overbought in the near term!


The FED has signalled that it wishes to keep rates at record lows well into 2013!----the recovery must be more fragile than they first thought.


Overall, I would refrain from any risk taking at the moment and would look to hedge gold positions. In the medium term, I expect gold to continue to be volatile in a price range of $1550 to $1780(New all time high as of today).

Will come back with some market specific ideas soon.

Tuesday, July 19, 2011

US ADJUSTED MONETARY BASE - Chart from St Louis FED

Clearly there's more stimulus to come, as the never ending recovery from those dark days in 2008 continues. The FED really has a tough job on its hands.
..
Talks of a possible QE3 could add more fuel to rising commodity prices, while a cancellation of a proposed plan for QE3, will not go down well in these jittery markets!

Below are two Charts of the Adjusted US Monetary Base. (5year + Long Term)
2011 has seen the graph spike sharply updards, a trend that is clearly not sustainale !


Meanwhile the Precious Metals sector has had quite a rally over the past week, with Gold prices topping $1600, and Silver just about getting over the $40 level. Perhaps, the Gold market is pricing in a possible QE3 further down the line.
I continue to be cautiously optimistic on the precious metals sector over the next month and a half; i.e. until the end of August 2011. These summer months have traditionally been seasonally weak for the PM sector.

Monday, May 2, 2011

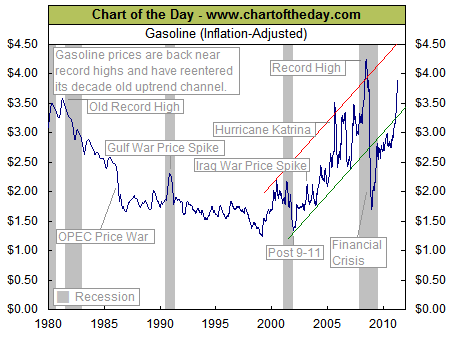
RISING GASOLINE PRICES

A chart from http://www.chartoftheday.com/.

A weak USD and high Crude Oil prices has resulted in rapidly rising gasoline prices.

Wednesday, April 27, 2011

USD - WHERE TO NEXT ?

Here is a USD update from Graham Summers of Gains Pains & Capital.com


April 25, 2011: Graham Summers’ Free Weekly Market Forecast (China Dumping Dollars edition)


His analysis is always insightful and he is always willing to tell it like it is.


The USD has clearly been under pressure recently. It is oversold at the moment and even though the Bullish Bear has a long term bearish view on the USD, I continue to believe that the current rally in the EURO and the GBP will soon see a reversal.

The Euro and the GBP have their own issues as well! ...facts that the market is currently ignoring!

Will the USD take out the 2008 lows? Watch this space!


Gold and Silver have had a fantastic run, although Silver prices pulled back quite sharply this week after almost reaching $50.

As you can see from the third chart, Silver had a lot of catching up to do, and since mid 2010, it has caught up with Gold quite swiftly.


I continue to advise caution on Silver prices, as prices have already risen significantly and a further pullback over the near term can be expected.


Saturday, March 12, 2011

GEOPOLITICAL NEWS IMPACTING MARKETS

The last couple of months have really been a roller coaster ride for the world economy.

Whether its the unrest in the Middle East leading to surging Crude Oil prices, or rising food prices or EU Sovereign debt troubles, or the recent Japanese Quake and resulting Tsunamis...... a lot has been going on.
The incredible damage to property and the loss of innocent lives in case of the Japanese quake is really tragic.

There was another important bit of news that went by unnoticed.
"" Wisconsin Gov. Scott Walker on Friday signed into law the controversial bill that eliminates most union rights for public employees""
Wisconsin governor signs anti-union rights bill World DAWN.COM
Wisconsin governor signs into law union curbs Reuters
Clearly the crisis on Main Street is not over yet. As David Rosenberg recently said, the impact of cost cutting and downsizing at the state and local government level will really undermine the '''ongoing consumer recovery'''
So I think that it's time that the guys on Wall Street sit up and take notice.
.
The Dow Jones may continue to brush off the impact of rising gasoline & food prices and the discontent on Main Street for now, but the prudent investor must realise that its now too late to join the equity market bandwagon. The risk reward ratio is not in favour of the ''long only'' investor and his margin of safety is far too inadequate at the current time.

Monday, March 7, 2011

IS THE USD OVERSOLD ?

Even as the EURO continues to rally, the USD is breaking down through some critical levels.


While regular readers know my long term view on the USD, let's not forget that the USD appears to be oversold at the moment.


Below is a screenshot of the CNBC website-7th March 2011 - A classic contrarian indicator! As traders get caught up in the surge in Silver prices, everyone is bearish on the USD all of a sudden.
Turmoil in the middle east and North Africa continues to dominate news headlines, easily crowding out news of dissatisfied government workers' unions and the ongoing austerity measures being implemented by state and local governments in the USA.
.
Discerning readers will realise that the troubles with Club Med and the 'PIIGS' are far from over.
.
Meanwhile the price of Crude Oil continue to trend upwards, and with the US unemployment rate near 10%; this will add further stress to the recovery on main street.
.
The stock markets may continue their upward rally for now, but a toxic combination of high unemployment and rising food & energy prices may be just as detrimental to the US Equity market rally as they proved to be for the ''dictators'' of North Africa.
.
A sell off in the overbought equity markets could trigger a counter trend rally in the oversold USD.

Saturday, December 18, 2010

UPDATE : 30 YEAR US TREASURY BOND

The recent sell off in US Treasuries comes at a time when the FED continues onward with its QE2 programme.

The USD too has weakened somewhat over the last few months, even against the troubled EURO.

Could this Bond market sell off further complicate the attempts of the FED to revive the ''global'' economy? Falling Bond prices means that yields will rise, a fact that will not go down well in a market where credit growth is actually contracting. If mortgage rates start to rise, the US housing market will face further headwinds.

WATCH THIS SPACE!

Friday, September 17, 2010

GOLD - IT'S RALLYING AGAIN !

Just about everyone seems to be bullish on gold at the moment.

As bullish momentum takes over, we could be in for higher prices in the days ahead.

Over the last month, silver has soared from levels of $18 -$18.50 to almost $20.80 currently.


Below is a chart by Chris Vermeulen, who acknowledges the currrent bullishness, but wisely takes a step back to take a look at the ''big picture''

Here is Chris Vermeulen's article on kitco.com


While I remain both a gold bug & bull, it's worth noting that the equity markets may be overly optimistic about earnings estimates for the second half of 2010.

The USD has been beaten down by the recent lack of risk aversion.
/
If market tremors re emerge, gold could sell off. Just to put things in perspective, a 20% sell off from the current level of $1273 will still mean that gold will continue to trade over $1000.
.
All that I'm saying is that fresh buying may be postponed for the time being, and that its advisable for long only, long term investors to wait for a pull back before jumping in at current prices!

Friday, July 16, 2010

SHANGHAI COMPOSITE IND. vs. DJIA

The Shanghai Composite is clearly not mirroring the move in the DJIA. Chinese stock markets are testing new lows for the year as concerns of a stumbling recovery in the developed markets continue.

Will we see a revaluation in the Chinese Yuan? Currency markets have been all over the place. The Euro has rebounded of recent panic lows even as sovereign debt troubles in the 'PIIGS' nations remain unresolved.
The USD has given back some of its recent gains, mainly due to an improving risk appetite and the subsequent rebound in global equities.

But as David Rosenberg recently said, are the Chinese Equity markets and the Baltic Dry Index warning investors that we could be in for a difficult second half in FY10?
Perhaps it's now time to be cutting back on risky assets and looking at minimizing portfolio volatility.

Wednesday, May 5, 2010

......AND THE 'VIX' SOARS

Over the last couple of years, I've grown wary, well almost fearful when anyone says that any financial mess or crisis is '''contained'''.

Now, whenever I hear that the damage has been contained, I have come to expect the eventual cost of the crisis to be a whole lot more than initially estimated.

Some say that the crisis in Club Med is contained and that there is no risk of contagion.
Still others say that the finances of some states in the U.S.A., are not as terrible as pessimists may fear.

The prudent reader must read between the lines and ignore the noise in financial news as he makes his/her investment decisions.

The US is not immune to the current crisis in the Eurozone. A weak Euro will hurt US exports to Europe and subsidize European exports to the U.S.A.

Emerging market exporters are not immune to a slowdown in developed markets in the west.

As I've said in recent posts, it's not a time to be taking unnecessary risks.
Gold prices in the meantime have held up really well, despite a rally in the USD and a sudden sell off in global equity markets.

Thursday, April 29, 2010

INDIAN EQUITIES INDICES : % Weights by Sector.

Take a look at the newspaper clipping below.

The Indian Equity market provides international investors with an exposure to a well diversified emerging economy, that is not overly dependent on exports or raw materials and has a large domestic market.

BRIC nations like Brazil and Russia are more heavily concentrated on the commodity sector (basic raw materials).

China is an export oriented BRIC country.

However as the article says, the Agriculture and Trade sector are both absent from the NIFTY & BSE SENSEX.

Another point worth noting is the gradual rise in the % weight of the Banking and Financial services sector.
Internationally, both the FTSE (U.K) and the Hang Seng (Hong Kong) have considerable exposure to banking and financial services.

A Benchmark index must be truly representative of the underlying economy, and currently I feel that the Banking and Financial services' % weight in the index is too high.

In the long run, I would hope that sectors like Pharmaceuticals, Telecom, and Cement are given a greater share of the index.

The Automobile and FMCG sectors are also vital components when it comes to gauging consumer consumption demand.

Tuesday, March 23, 2010

Clive Maund on Gold

Clive Maund has a new gold update at Kitco, 22 March 2010.
http://www.kitco.com/ind/maund/mar222010.html


I have not added to gold positions recently, and remain slightly wary of a ''summer sell off'' in equity markets that may trigger a sell off in the precious metal markets.

The USD has been trending upwards, aided by the turmoil in the Eurozone; that has kept the EURO in check.

But I must say that inspite of the strength in the USD, gold prices have continued to consolidate.