Showing posts with label US RECESSION. Show all posts

Thursday, August 30, 2012

$16,000,000,000,000 !!!!


Well depending on where you read it, US Debt has now already crossed / is about to cross the $16 trillion mark!
(Yes, that's a large number of ZEROS!)

What is worrying is the rate at which it has risen this past year and the prudent market watcher can only worry about the cost of servicing this massive debt in the future once interest rates rise!!

Meanwhile, markets were trending upwards ahead of  the Federal Reserve's annual  symposium at Jackson Hole. However, it now appears that we may not hear anything new and markets are heading into the annual meet in a rather lacklustre manner.
So no QE3 for now I guess??

"""""November 16, 2011 was a historic date: that's when the US officially surpassed $15 trillion in debt for the first time since World War 2. We celebrated it by cheering $15,OOO,OOO,OOO,OOOBAMA. Today, August 28, 2012, is when we can unofficially celebrate again, because 286 days after the last major milestone was surpassed with disturbing ease, total US debt following today's $35 billion auction of 2 Year bonds is, well, in a word: $16,OOO,OOO,OOO,OOOBAMA! 
The result: $16.05 trillion, which is what the debt to the penny will officially show next week.
          ..................................................
          ....................
Of course this will be the total following the balance of this week's auctions. In the meantime, the US is now officially between that ceiling and a $16 trillion floor.
But wait. You aint's seen nothing yet. At this rate of growth, total US debt will surpass:

  • $17 trillion on June 10, 2013;
  • $18 trillion on March 23, 2014;
  • $19 trillion on January 3, 2015; and
  • $20 trillion on October 16, 2015
And on, and on, and on..."""""
MORE LINKS :

Some clear thinking on the debt

""""August 29, 2012Rome, Italy
If you haven’t heard yet, the United States of America just hit $16 trillion in debt yesterday. On a gross, nominal basis, this makes the US, by far, the greatest debtor in the history of the world. 
It took the United States government over 200 years to accumulate its first trillion dollars of debt. It took only 286 days to accumulate the most recent trillion dollars of debt. 200 years vs. 286 days.
This portends two key points: 
1. Anyone who thinks that inflation doesn’t exist is a complete idiot; 2. To say that the trend is unsustainable is a massive understatement.    """""""


Sunday, August 19, 2012

Chart of the Day: Chinese stocks in steep downtrend & CBOE VIX AT NEW LOWS

As stock markets around the world continue to edge upwards, the Chinese Equity Markets and the CBOE VIX have both been trending downwards.

Chart of the Day - Chinese stocks in steep downtrend

Equity valuations continue to be driven by hopes of QE3 and Bailouts/handouts by Central Bankers rather than fundamentals, which at this stage are still looking rather weak.

As the VIX trends to new lows, it's important to take profits in stock portfolios and rebalance them towards more stable large cap companies that preferably have less leverage than their mid-cap counterparts.


Wednesday, August 24, 2011

GOLD : Overextended after a massive run : more volatility to come

After testing $1900, gold prices have corrected sharply. In the near term prices continue to remain overextended, well above supporting trendlines at $1640.

I continue to remain a long term bull, but would once again remind readers that in the short term, gold prices will continue to be volatile and reacting to options expiration and the FED's Jackson Hole meeting at the weekend.

Here is a fantastic chart from Jesse's Café Américain - a super site for all gold related news and excellent unbiased market analysis.

Tuesday, August 16, 2011

Thomas Friedman - on a Theory of Everything (sort of)

A precise article by Thomas Friedman about the current state of unemployment, credit and strained government finances.

A Theory of Everything (Sort Of) - NYTimes.com


Wednesday, August 10, 2011

MARKET UPDATE: THESE ARE CRAZY DAYS

Just a quick post today before I put up some detailed analysis soon.


There's so much happening in markets these days - Debt Ceiling, US AAA downgrade, Equity Market crashes, a really manic VIX (Volatility S&P500 ^VIX), UK Riots and all the ongoing discussion of the ''fragile'' global economic recovery!!


Below is a snapshot of todays wildly gyrating markets! For the ''goldbugs'' out there, Gold has been riding high, driven upwards by all the uncertainty & it is overbought in the near term!


The FED has signalled that it wishes to keep rates at record lows well into 2013!----the recovery must be more fragile than they first thought.


Overall, I would refrain from any risk taking at the moment and would look to hedge gold positions. In the medium term, I expect gold to continue to be volatile in a price range of $1550 to $1780(New all time high as of today).

Will come back with some market specific ideas soon.

Thursday, July 28, 2011

THE ONGOING RECOVERY - NOT!

As the US Government is negotiating to raise the US Debt Ceiling, Central Bank Governors around the world are struggling to keep the fragile economic recovery intact while tackling inflation concerns at the same time.

Below are some magazine covers, that you would not expect to see at this stage of a economic recovery!


Wednesday, April 13, 2011

ROBERT PRECHTER : 6 TRENDS ABOUT TO REVERSE

Here's an article I came across in 'The Business Insider' > Robert Prechter: These 6 Trends Are About To Reverse
"

Prechter argues there are several themes out there right now that investors, economists, and markets all believe to be true just like they did with interest rates in the 1980s.


  • The dollar - everyone is bearish.


  • Interest rates - everyone thinks they're going to rise.


  • The stock market - everyone is bullish but corporate insiders.


  • Inflation expectations - everyone thinks it is going to go higher.


  • Economy - everyone is confident in 2011.


  • Oil - everyone thinks it is heading higher.

"


He makes some really valid points. Ignore the principles of 'Madness of crowds' and 'mean reversion' at your own risk.

Saturday, April 9, 2011

SILVER FEVER !!

Most fans of the precious metals sector will obviously be over the moon after the monstrous rally in Silver in 2011 so far.

The USD continues its sell off, while the Euro rally continues despite all the trouble with Club Med.

With all the momentum in Siver bullion, prices could rise still further.

Personally, I would advise against any opportunistic buying at the moment, as the risk reward ratio is clearly against the long only trader for now.

For those investors with access to hedging strategies, perhaps they can use put options to protect long positions, given the overbought position in Silver.

Mr P. Radomski of Sunshine Profits has some excellent analysis in his latest free update.

Monday, March 28, 2011

THE FED & the US ADJUSTED MONETARY BASE

Here is a follow up post to my March 15, 2011 post on the correlation of the S&P 500 with the size of the FED Balance Sheet.

Graham Summers of ''Gains Pains Capital'' has also put up a detailed note on the US Monetary Base.


Below is a chart from the above mentioned article.

Friday, March 25, 2011

EVENT RISK FOR MARKETS - CAVEAT EMPTOR

Global equity markets these days seem to be totally unaffected by all the geopolitical turmoil and natural disasters of the last few months.

Once again the ever cautious David Rosenberg chips in with words of wisdom, alerting investors to the many risks that the market is currently ignoring. (Note to readers - David Rosenberg's Newsletter ends its free trial period this month, so this will be the last of his charts on this blog)

Tuesday, March 15, 2011

S&P 500 vs The FED's BALANCE SHEET

Investment Guru David Rosenberg in recent writings has commented on the positive correlation of the rally in the US Equity Markets and the size of the Balance Sheet of the US FED.

Here is yet another article from Jim Sinclair's Mineset website that supports Rosenberg's view.
This is some excellent research by Trader Dan Norcini and is worth a read.

S&P 500 Versus The Fed’s Balance Sheet
(LINK FOR CHART FROM JIM SINCLAIRS WEBSITE)

Saturday, March 12, 2011

GEOPOLITICAL NEWS IMPACTING MARKETS

The last couple of months have really been a roller coaster ride for the world economy.

Whether its the unrest in the Middle East leading to surging Crude Oil prices, or rising food prices or EU Sovereign debt troubles, or the recent Japanese Quake and resulting Tsunamis...... a lot has been going on.
The incredible damage to property and the loss of innocent lives in case of the Japanese quake is really tragic.

There was another important bit of news that went by unnoticed.
"" Wisconsin Gov. Scott Walker on Friday signed into law the controversial bill that eliminates most union rights for public employees""
Wisconsin governor signs anti-union rights bill World DAWN.COM
Wisconsin governor signs into law union curbs Reuters
Clearly the crisis on Main Street is not over yet. As David Rosenberg recently said, the impact of cost cutting and downsizing at the state and local government level will really undermine the '''ongoing consumer recovery'''
So I think that it's time that the guys on Wall Street sit up and take notice.
.
The Dow Jones may continue to brush off the impact of rising gasoline & food prices and the discontent on Main Street for now, but the prudent investor must realise that its now too late to join the equity market bandwagon. The risk reward ratio is not in favour of the ''long only'' investor and his margin of safety is far too inadequate at the current time.

Monday, February 28, 2011

US HOUSING MARKET & the 30 YEAR FIXED RATE MORTGAGE

Home prices in the U.S. will continue to face headwinds as the 30 year fixed rate mortgage rate continues to climb despite the FED's best efforts in QE2.
A combination of declining home prices, rising food and energy prices and persistantly high levels of unemployment will continue to weigh down on the economic recovery.

Thursday, February 24, 2011

IT'S NOT OVER YET !

Here's David Rosenberg with more words of caution.
It's not over yet!

Wednesday, February 16, 2011

Kick the can down the road, as far as it will go, buy as much time as possible!

As the ongoing bull run in the equity markets continues, I thought that it was appropriate to post some charts from Breakfast with Dave - 18th Jan, 2011.
Complacency and exuberance and ''bullishness'' is blinding speculators and investors to the many structural problems of today's global economy.

Job creation and food security ( in both the developed world and emerging markets) are going to be crucial issues going forward, and unfortunately the ongoing policies of governments worldwide are continuing to fuel asset price inflation and stock market rallies rather than addressing the real problems we have at hand.
.
.

Tuesday, January 11, 2011

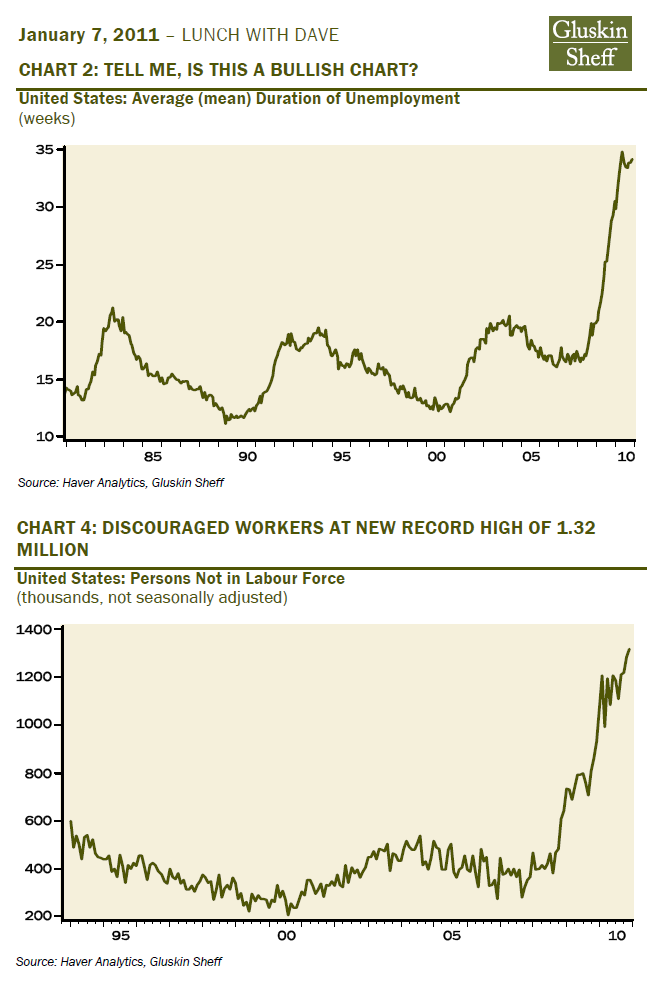
DAVID ROSENBERG on US UNEMPLOYMENT

The graphs below come from 'Lunch with Dave' - January 7, 2011.

..

Saturday, January 8, 2011

SILVER - OFF TO THE RACES !

Silver has been a star performer over the last year.
While prices have corrected slightly from a level of just over $31/oz, the overbought condition in silver means that there could be further downside in the near term if lasts week's weakness in the commodity markets persists.

Below is a chart from some excellent analysis from Adam Hamilton of www.ZealLLC.com

Friday, December 31, 2010

EURO - OUTLOOK 2011

The Euro currency faced a turbulent 2010.
As concerns continue to mount over the finances of the '''PIIGS''', 2011 could mean even more volatility.

Will the easy money/quantitative easing policy of the USA or the austerity measures of the Eurozone be successful?
Here is a chart and an article by Graham Summers of Gains Pains & Capital on the EURO crisis.

Thursday, September 30, 2010

LENGTH OF U.S. RECESSIONS

Here are a couple of charts on the ''now ended'' Great Recession.